Analytics often get overlooked when launching courses, but they’re one of the best ways to turn good content into great results. I’ve used LearnWorlds analytics with creators to spot drop-offs, fix weak sections, and boost completion rates—sometimes by 30-50% after simple tweaks.
LearnWorlds provides robust, built-in tools as an online class platform: a main dashboard for quick overviews, Reports Center for detailed user progress, Product Insights for course-specific data, and AI-powered insights for fast answers. These help you track engagement, identify friction points, measure completion, and make data-driven improvements.
This guide covers how to access and use these features practically to improve your courses.
Understanding the Main Analytics Dashboard
Your starting point is the main dashboard—right when you log in.
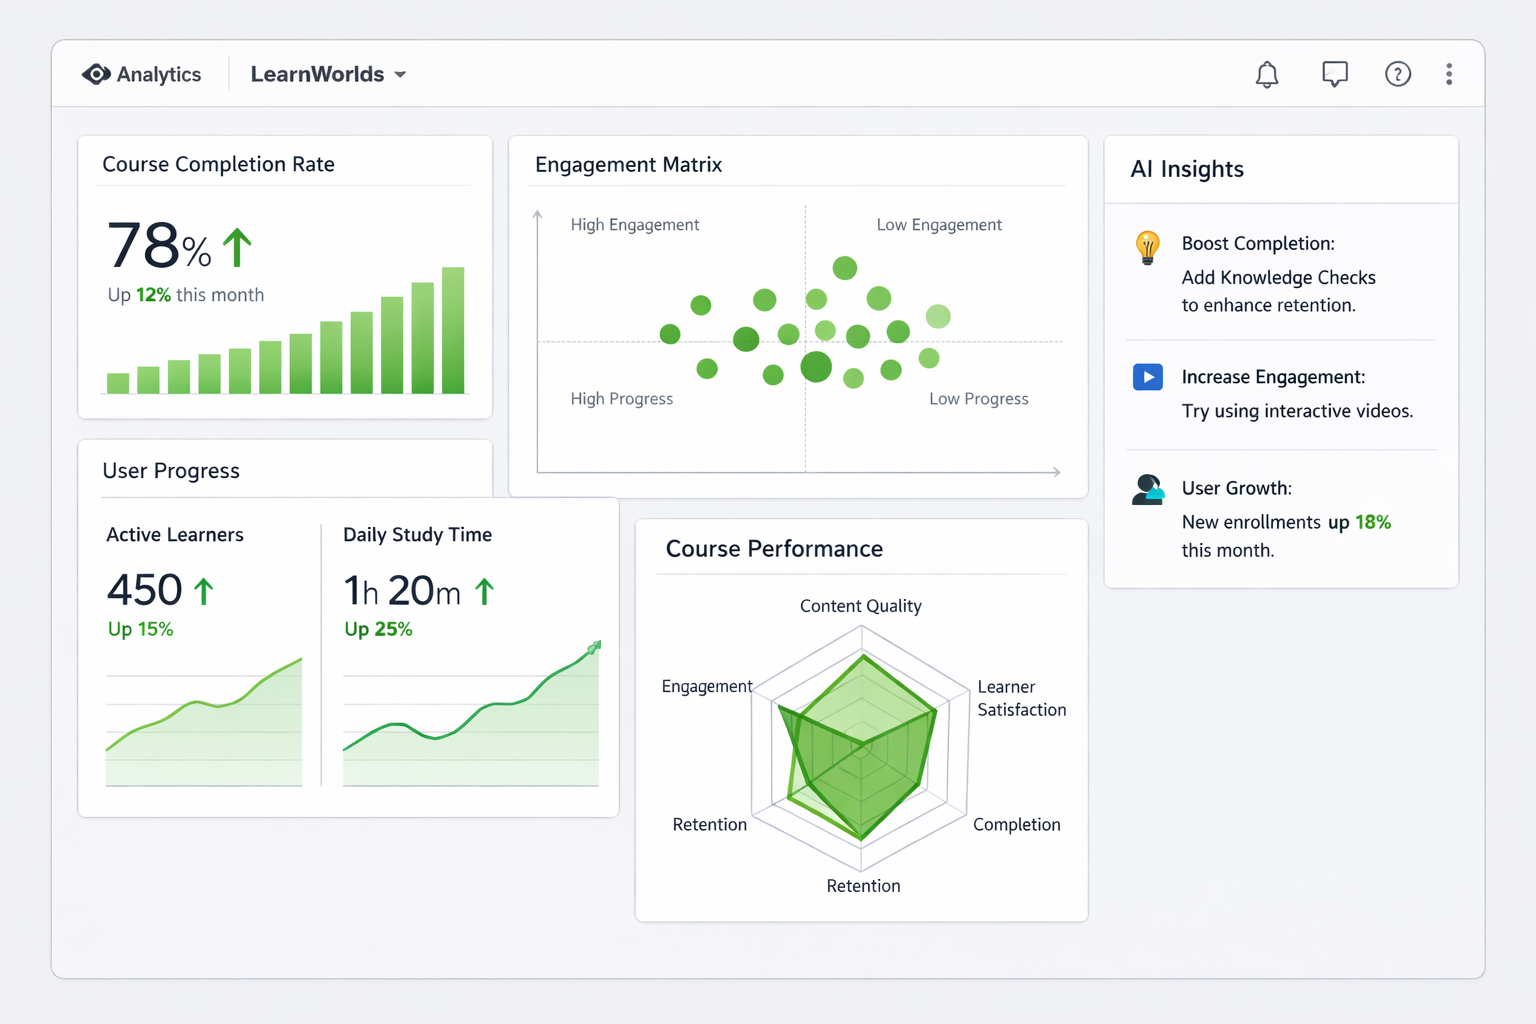
It shows key metrics at a glance:
- New signups and active users
- Revenue and product sales
- Overall engagement trends
- Recent activity
Use this for quick health checks. If signups are up but completions are flat, dive deeper into reports.
The dashboard also includes quick links to Reports Center and AI Insights Hub for faster analysis.
Key Analytics Sections: Reports Center and Product Insights
LearnWorlds has two main hubs for deeper data.
Reports Center — Navigate to Reports → Reports Center. This is your flexible engine for:
- User progress across all courses
- Filters by date, course, attributes
- Preset and custom segments (e.g., high-engagement users)
- Exportable reports
Product Insights — Go to Reports Center → Product Insights (or inside a specific course’s insight tab). Compare courses, see:
- Overall metrics (enrollments, completion %, average scores)
- Activities breakdown (time spent, engagement per section/lesson)
- Course users list (individual progress, time on platform, scores)
These sections reveal where students struggle—e.g., high drop-off in a video or low quiz scores.
Tracking Engagement, Completion, and Performance Metrics
Focus on these core metrics to improve performance:
- Completion rates — % of learners finishing the course (track overall and per section).
- Engagement levels — Time spent, video views, interactions (quizzes, assignments).
- Drop-off points — Identify lessons with high abandonment.
- Assessment performance — Quiz/exam scores, question difficulty.
- User progress — Individual or segmented views (e.g., via Training Matrix or Activity Matrix).
Use radar charts for top courses (engagement vs. completion vs. time spent) and heatmaps for video engagement.
AI Insights Hub lets you ask questions like “Which sections have the lowest completion?” and get instant graphs or answers.
Step-by-Step: Using Analytics to Improve Your Courses
Here’s a practical workflow:
- Log in and check the main dashboard weekly for trends (signups, revenue, active users).
- Go to Reports Center → Product Insights → select “All Courses” or a specific one.
- Review overall metrics: Look at completion %, success rate, average time spent.
- Dive into Activities Breakdown: See engagement per section—spot low-interaction lessons.
- Check Course Users tab: Sort by progress/score to find struggling students or patterns.
- Use filters/segments: Create custom segments (e.g., users who dropped at module 3).
- Ask AI Insights: Query specifics like “Show drop-off reasons” or “Compare course A vs B engagement.”
- Act on insights: Add interactivity to weak sections, shorten videos, improve quizzes.
- Schedule reports: Set automated emails for ongoing monitoring.
- Retest: After changes, track the same metrics in 2-4 weeks.
This cycle turns data into real improvements.
Real-World Example and Data Insight
A fitness course creator I advised noticed 40% drop-off at a long theory module via Product Insights activities breakdown. Video heatmaps showed viewers stopping midway. They shortened the video, added mid-video quizzes, and used AI to generate pop-up questions. Completion rose 45%, and average scores improved.
Insight: LearnWorlds’ detailed breakdowns (like activities matrix and AI queries) help identify specific friction points faster than basic platforms—many creators report quicker optimizations because data is visual and actionable right in the dashboard.
Common Mistakes and Troubleshooting Analytics Issues
- Checking sporadically — Miss trends. Fix: Set weekly reviews or scheduled reports.
- Ignoring segments — Broad data hides issues. Fix: Use filters/custom segments.
- Not acting on drop-offs — Data without changes is useless. Fix: Prioritize top 2-3 fixes.
- Overlooking video stats — Videos drive engagement. Fix: Review heatmaps regularly.
- No baseline — Hard to measure improvement. Fix: Export initial reports before changes.
- Plan limitations — Some advanced AI/reports on higher tiers. Fix: Upgrade if scaling.
Start simple—focus on one course’s completion data first.
FAQs
How do I access LearnWorlds analytics reports?
Go to Reports in the dashboard → Reports Center for user progress, or Product Insights for course details.
What key metrics should I track for course performance?
Completion rates, engagement time, drop-off points, quiz scores, and section-level activity.
Does LearnWorlds have AI for analytics?
Yes—AI Insights Hub answers questions, generates graphs, and provides predictive insights instantly.
Can I export LearnWorlds analytics data?
Yes—export reports from Reports Center for CSV analysis or sharing.
How do analytics help improve student engagement?
Spot low-interaction areas, add quizzes/hotspots, and personalize based on progress patterns.
Where can I find official LearnWorlds analytics guides?
Check the help center: LearnWorlds Analytics & Reports and Reports Center articles.
Improve Your Courses with LearnWorlds Analytics
LearnWorlds analytics give you clear visibility into what’s working and what needs fixing—dashboard overviews, detailed reports, product insights, and AI for quick answers. Use them regularly to raise completion rates, engagement, and satisfaction when you create course online and make online courses.
Start by checking your dashboard and one course’s Product Insights today. Small, data-backed changes add up fast.
For more on interpreting specific metrics or optimizing based on your niche, visit https://shihabmorshed.com/. What’s one metric you’re curious about in your courses? Share in the comments—I’ll help break it down.